This article is part of our The Z Files series.
"I believe that the more you know about the past, the better you are prepared for the future." - Theodore Roosevelt
I doubt the 26th President was referring to fantasy baseball, but it would have been apropos. In this case, the past is baseball's run-scoring environment through May. The future is what we can expect for the final four months.
Runs per game, as well as many of the factors contributing to scoring, will be analyzed. What has transpired over the first two months will be compared to 2021-2023. A simple snapshot of average stats per month will be included along with a rolling average.
By Month
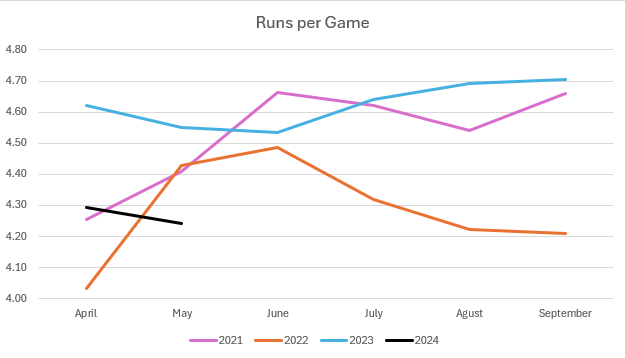
Scoring in 2024 is at its nadir during the four-season window. In 2021 and 2022, runs per game increased from April to May. Last season, they dipped, in a similar manner to this season. In 2021 and 2022, scoring peaked in June, but last season it continued trending downward before gradually increasing beginning in July. Let's see if we can discern where scoring is headed this month using rolling nine-day averages.
Rolling Average
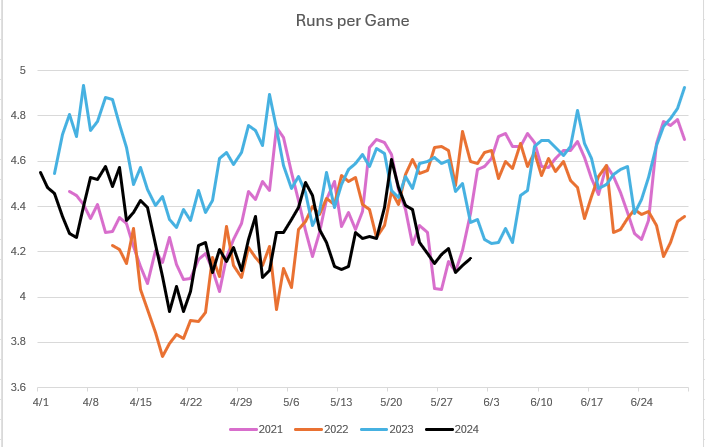
Admittedly, the graph is a bit busy, but it does illustrate that even when the data is smoothed using a nine-game rolling average, variance abounds. To be clear, each data point displays the average runs per game from four days before the date through four days after.
Presently, we're tracking like 2021. Here are the end-of-season averages, along with where we are to date this season:
| Year | Runs per Game |
|---|
"I believe that the more you know about the past, the better you are prepared for the future." - Theodore Roosevelt
I doubt the 26th President was referring to fantasy baseball, but it would have been apropos. In this case, the past is baseball's run-scoring environment through May. The future is what we can expect for the final four months.
Runs per game, as well as many of the factors contributing to scoring, will be analyzed. What has transpired over the first two months will be compared to 2021-2023. A simple snapshot of average stats per month will be included along with a rolling average.
By Month
Scoring in 2024 is at its nadir during the four-season window. In 2021 and 2022, runs per game increased from April to May. Last season, they dipped, in a similar manner to this season. In 2021 and 2022, scoring peaked in June, but last season it continued trending downward before gradually increasing beginning in July. Let's see if we can discern where scoring is headed this month using rolling nine-day averages.
Rolling Average
Admittedly, the graph is a bit busy, but it does illustrate that even when the data is smoothed using a nine-game rolling average, variance abounds. To be clear, each data point displays the average runs per game from four days before the date through four days after.
Presently, we're tracking like 2021. Here are the end-of-season averages, along with where we are to date this season:
| Year | Runs per Game |
|---|---|
| 2021 | 4.53 |
| 2022 | 4.28 |
| 2023 | 4.62 |
| 2024 | 4.32 |
Intuitively, scoring should pick up in June as the mercury rises, but this time last season runs per game dropped.
Two of the driving forces of scoring are home runs and BABIP. Perhaps we can get a better feel for where runs are headed if we can see trends with the components.
By Month
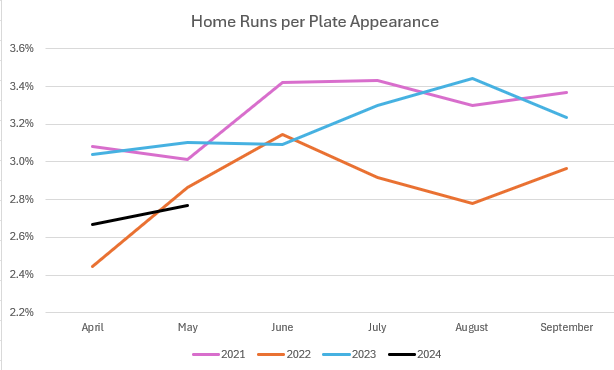
For years, home runs trended like 2021 and 2022. The levels were different, but the pattern was always similar. For whatever reason, last year bucked the trend. Homers started a bit high, then held fairly constant through June. Power steadily increased, peaking in August before falling back again. An argument can be made for this season to stay flat like last season, or spike like previous seasons. We'll take a look in a moment, but the deader ball in 2024 may have a counter-effect to the warmer temperatures, keeping homers down. But first, here is the rolling average chart to check out trends.
Rolling Average
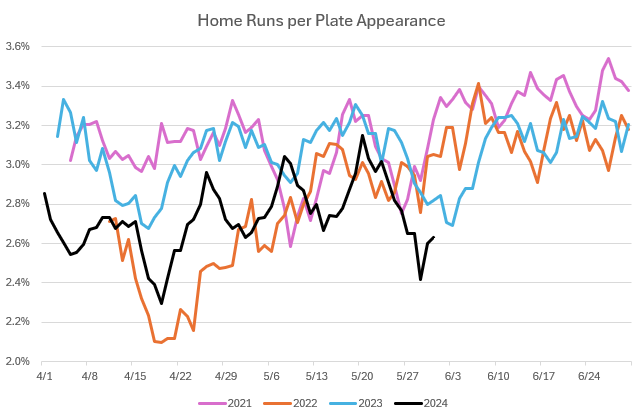
The baseline is lower, but we're tracking like last season. The rate by the end of June has been at least 3.2 percent. It's unlikely we reach that level, but homers are likely due for a weather-related increase.
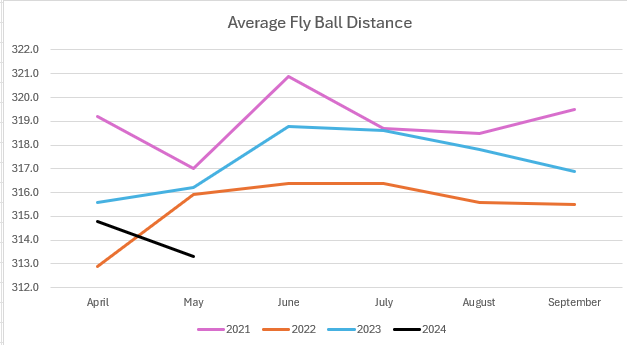
Earlier, it was mentioned that the ball seems deader this season. That is, it doesn't seem to be traveling as far when struck with the same exit velocity as previous seasons. Let's look at flyball average exit velocity and average distance since 2021.
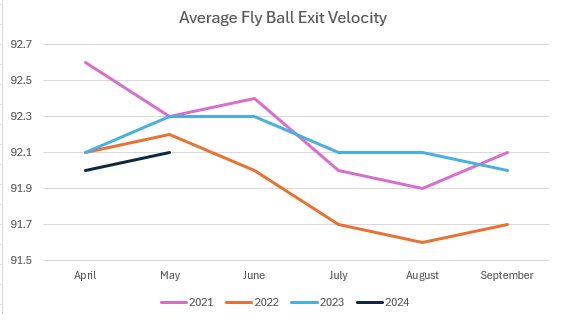
In theory, the trend of the two plots should be similar each year: the harder you hit the ball, the further it goes. However, that's just one factor. Atmospheric conditions, as an example, can have an influence.
Furthermore, the relative distributions of the Y-axis aren't the same, which can be visually misleading. Here are the two previous graphs side-by-side with the data normalized and the same Y-axis.
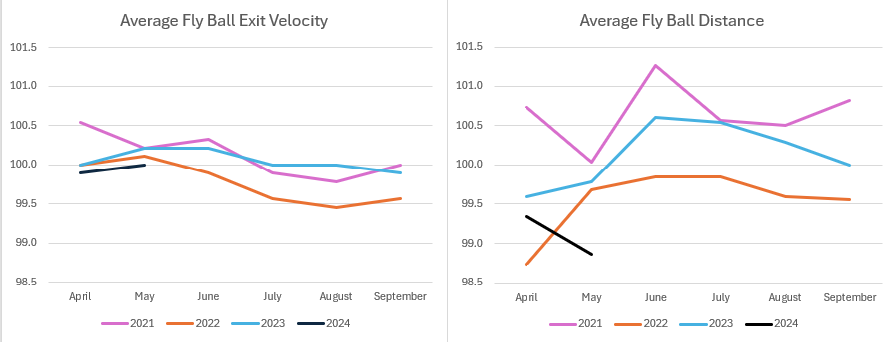
The oddity of what's happening this season aside, on a relative basis, a small change in exit velocity leads to a larger change in flyball distance.
Shifting the focus to this year, look at 2024 and 2022. The average flyball exit velocity lines are essentially parallel. In 2022, flyballs traveled further in May. In 2024, with the same increase in exit velocity, the ball traveled less in May. However, home runs per plate appearance increased in May, despite a shorter average flyball distance.
The correlation between average flyball distance and home runs per plate appearance isn't perfect, so we're witnessing arbitrary endpoint variance. Variance is not our friend when undertaking studies of this nature, but it's always a factor, clouding observations and conclusions.
Intuitively, flyball distance should increase in June, as it has each of the past three seasons. The question is, how much further will the ball fly? Here are the percentage increases from May to June over the past three seasons.
| 2021 | 2022 | 2023 |
|---|---|---|
| 1.2% | 0.2% | 0.8% |
It's interesting to note that in 2022, the increase was smallest, and the starting point was lowest. Since we're currently even lower, perhaps the increase won't be as much as 2021 or 2022. Or maybe the increases are affected by external factors such as wind and temperature, so who knows what lies ahead in June?
The X-factor is the current average flyball distance is at the lower end of the range in which it has less of an influence on home runs. Research I've presented in this space previously demonstrated there isn't a linear relationship between average flyball distance and home run rate. The impact is flatter in this range. If the increase propels the average flyball distance into the territory where the slope is steeper, homers could increase at a rapid rate.
Something to keep in mind is the primary purpose of this research is to decide when to ease up on streaming lesser pitchers. The optimal time to stream is when the run-scoring environment is lowest. This isn't comparing across years, but comparing segments within each season. Scoring may be down all season, but that doesn't mean it's fine to stream all season. It's relative within that season's run environment. The idea is to stream during the parts of the season when runs are less frequent... which usually commences right around now.
Homers are only part of the story. Let's add flyball and groundball BABIP to the equation. This time, I'll leave out the noisy rolling averages.
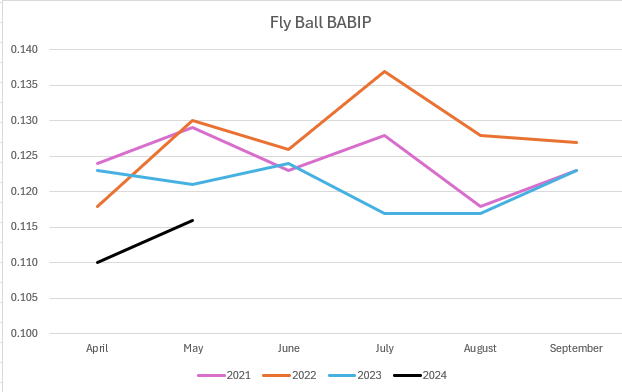
All the talk is about suppressed homers. Personally, the decrease in flyball BABIP is an underappreciated repercussion of the deader ball. Outfielders can play shallower, so they can catch more of the softly hit flies while also being able to track down those hit over their heads. This contributes to the lower run-scoring landscape.
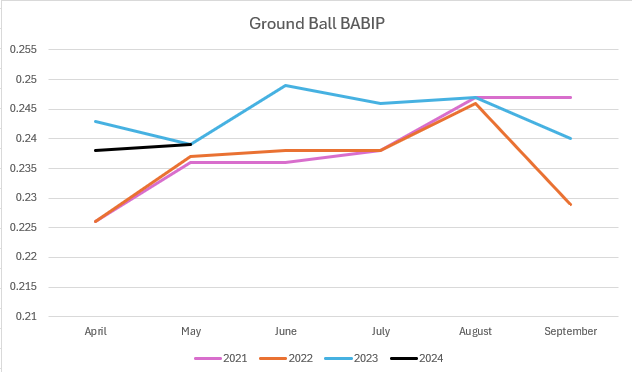
Keep in mind MLB began legislating the shift last season, largely due to the drop in groundball BABIP illustrated in 2021 and 2022. It clearly worked, with a high BABIP for most of the season. Curiously, BABIP on grounders dipped last September, as it did in 2022.
The level remains similar to last season and was similar in April and May. If nothing else, the dearth in scoring this season cannot be attributed to a sharp decline in groundball BABIP.
I'm going to assume some of you have the same question I'm pondering. Noting the change in BABIP is one thing, how much does it affect batting average and slugging percentage, and therefore run scoring?
An increase or decrease in groundball BABIP of .005 points changes the overall batting average between 0.0014 and 0.0018 points. The same difference in BABIP alters slugging between 0.0016 and 0.0019 points.
An increase or decrease in flyball BABIP of .005 points changes the overall batting average between 0.0008 and 0.0009 points. The same difference in BABIP alters slugging between 0.0013 and 0.0014 points.
The same difference in BABIP has a greater effect with grounders, but this is a volume thing. There are more grounders than flies, and don't forget home runs are excluded from the BABIP formula. On balls that stay in the yard, there are twice as many grounders as flies.
If we're talking about runs, the best metric to serve as a proxy is wOBA (weighted on base average). The same .005 difference in groundball BABIP changes wOBA by 0.0012 to 0.0015 points. The flyball delta is again smaller, between 0.0008 and .0009 points.
The decline in 2024 flyball BABIP is around .012, so the drop in wOBA is around .0026.
I know, now you're wondering how this difference relates to runs. On average, teams are scoring .08 fewer runs per game due to more flyballs being caught. That may not seem like much, but it's a tad over 25 percent of the difference from last year's average. The rest is homers.
| Year | Runs per Game | HR/PA |
|---|---|---|
| 2021 | 4.53 | 3.3% |
| 2022 | 4.28 | 2.9% |
| 2023 | 4.62 | 3.2% |
| 2024 | 4.32 | 2.8% |
If this season's HR/PA were just 3.0 percent, clubs would be averaging something more like 4.48 runs per game.
A lot of numbers were crunched to show the dead ball is limiting homers, which is driving the drop in scoring. Truth be told, this is intuitive. That said, I find it worthwhile to have uncovered that a lower flyball BABIP is involved as well.
The other takeaway is that we can't categorically expect homers to significantly increase. Prior to last season, the yearly trends were convincing. Now, between last season breaking the trend, and some inconsistencies with the 2024 data (HR% dropping despite average flyball distance increasing), I'm not comfortable unequivocally recommending that you back off streaming lower-tier pitchers, especially if their primary flaw is giving up homers.
But I can't confidently say "go for it" either.